This has been, by most accounts, a terrible year for markets. Global equities are down, bonds are terrible, and property prices are coming under pressure. So far it has been a lot like 2018 when almost no sector ended with gains.
Let’s dig in an have a look at the markets from 1 January through 9 December.
We have used Vanguard ETF’s in the chart below, as they are reasonably representative of the exposure that most managers will have if following a passive, index aware investment approach.
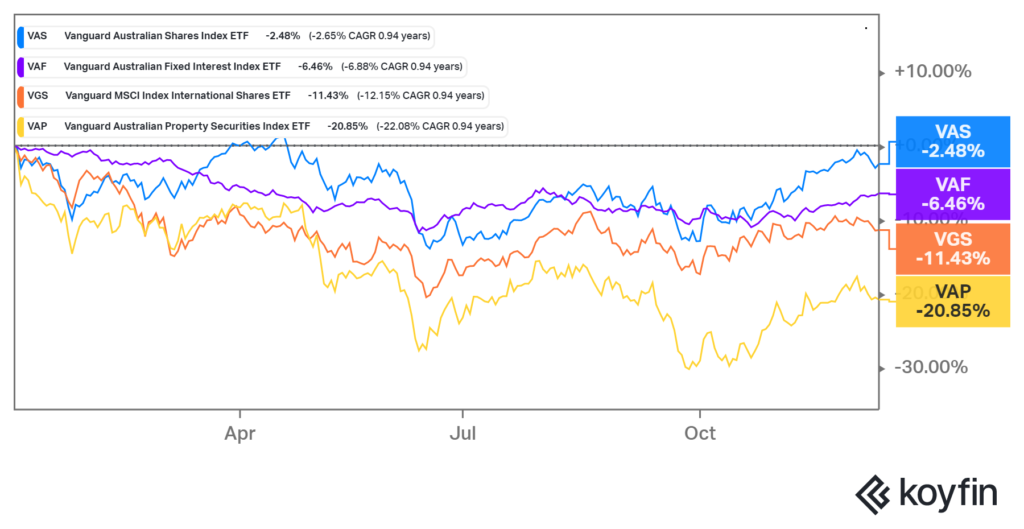
The big winner has been Australian shares, (VAS) which year to date are only down 2.48%, although in mid June, Aussie shares were down 14%. The solid clawback has mostly been as a result of Materials and Banks.
Australian Fixed income, (VAF) has been the runner up with a minus 6.46% result. Fixed income also hit its worst during the month of June, when the intra-year figure was minus 11.7%.
Global shares as represented by the Vanguard International Shares ETF (VGS) is still at minus 11.43% having been down by 20.5% in mid June.
To property, and although the Vanguard Australian Property Securities (VAP) only represents listed property trusts which have reacted very quickly to higher rates, the result there is minus 20.85% after being off as much as 30% in late September.
Financial Express Multi-Asset Balanced benchmark
Financial Express, an alternative managed fund researcher to Morningstar, estimates that from January to the end of November, the average multi-asset balanced fund in their universe is showing a -4.86% return.
During the year, the worst monthly data point for that benchmark at the end of September was -10.03%. In the two months of October and November the average fund has gained 5.7%. Which goes to show that knee jerk reactions generally lead to bad results. But that doesn’t mean we don’t consider the state of play and listen to the signals that the market is giving us so that we use bounces to potentially re-configure portfolios.
Risk and Reward
When we look at the Lonsec Risk Profile for a Balanced portfolio, with no Alternative assets, and a Strategic allocation of 60% Growth assets and 40% Income assets, we see that the last 15 years has produced a worst ever rolling 12 month return of -19.9%. (2008) When adding in Alternatives, (a risk mitigation strategy we endorse) the worst 12 month return drops to -14.9%.
The probability of a negative return on that Balanced portfolio is 1 in every 6.9 years.
These are the kind of numbers we have to expect if we invest in a typical balanced portfolio.
Is the worst behind us?
There is no way of knowing that for sure. One thing that seems obvious is that the worst economic headlines are yet to come.
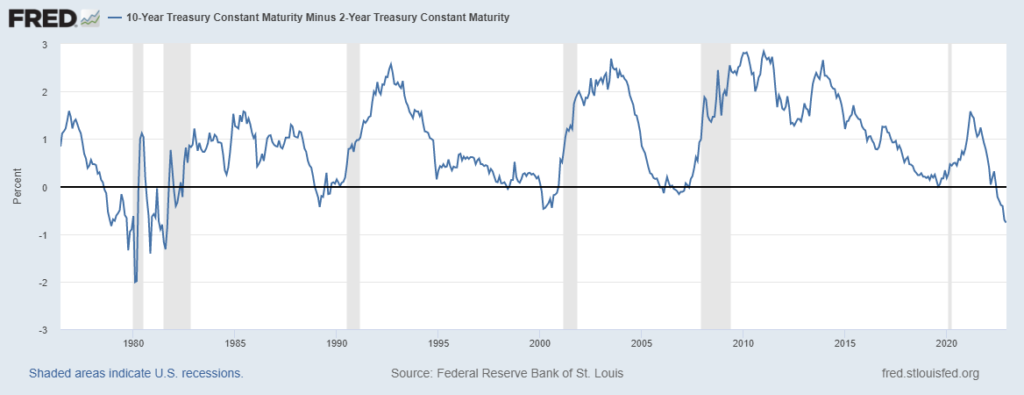
The US Yield curve sounded the first chime of a recession back in April 2022, and since July 5th, has been ringing the bell every day as the inverse yield curve has gone deeper and deeper into negative territory every day. In fact, it is now the most negative since the two back to back recessions we had in ’79 & ’82 when the Volker led Fed stomped inflation into the ground only after raising rates well above the rate of inflation.
The Global Recession Probability index published by Ned Davis Research has the recession probability at >90%.
Here in Australia the current consensus is that rates will top around 3.6%, with two more quarter percent rate hikes to come on February 7th and March 7th. As Christopher Joye pointed out in the AFR this week, around one in four borrowers will be rolling off the lowest fixed rates in history over the next twelve months, going from averages of around 2.25% to as much as 5 to 6% rates. At a 3.6% cash rate, Mr Joye estimates (and they do have extensive modelling at Coolibah Capital) that about 15% of all Australian borrowers will have negative cashflows after allowing for only ‘essential’ living expenses.
The conclusion is that no, economically the worst is probably not behind us.
Share Market movements
We have presented below a couple of charts with hand drawn notations (my research budget doesn’t run to a Bloomberg terminal) that show that last week may have been a critical juncture in the recent two month market rally.
The first, is the S&P 500 index of the largest US companies.
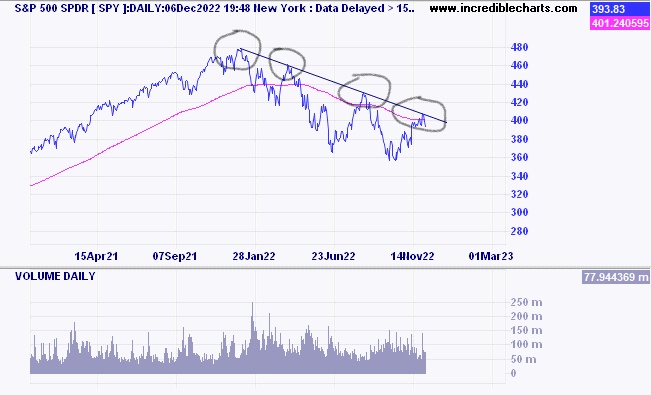
As you can see, there is a falling trendline which has four contact points so far. The 4000 level has been critical support before, and now it has become an overhead resistance level. That level is also where the 200 day moving average is an overhead barrier.
The second is the Australian sharemarket, where the All Ordinaries has turned down again from the 7520 zone, which acted as support in June, October and December of 2021, and since slicing through it in January 2022 has acted as resistance in February, June, and November.
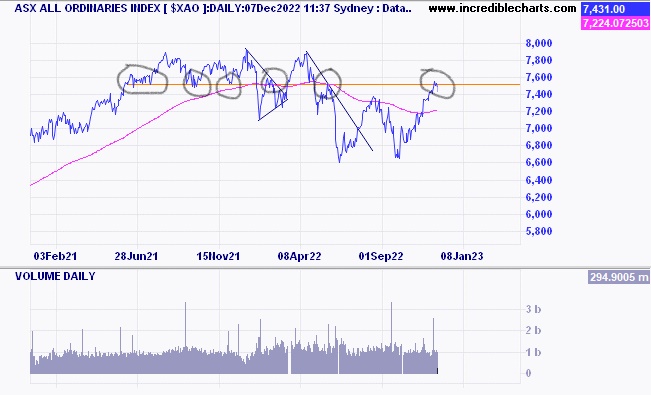
Two of the biggest sectors in our index, Materials and Banks are certainly not priced for a global recession. However, within the Materials index, some of the energy transition stocks still seem to be trading quite cheap when considering the future demand for their products.
The tug of war – Inflation vs Recession
This is the real battlefield which influences longer term interest rates and in turn the relative attractiveness of shares.
When it seems that Inflation is winning, and is likely to stay higher for longer, interest rate markets start to factor in cash rates remaining high, or even going higher than the current projected cycle peaks. This results in bond yields rising.
When Recession signals are gaining, and Inflation looks like it may be throwing in the towel, rates in the medium to longer term start to fall, as investors look for safe haven assets.
Share markets generally like falling interest rates, though not the steeply falling rates that portend a deep recession. The ‘goldilocks’ scenario is preferred. Inflation not too hot, GDP not too cold.
Right now, we are seeing a moderating in the pace of increase in longer term rates. In fact, the 10 year bond peaked in June at 4.20%, the 3 year bond in September at 3.80% and the 1 year bond in October at 3.45%. All are now lower than those peak rates, implying that the Recession scenario is now stronger than the Inflation scenario.
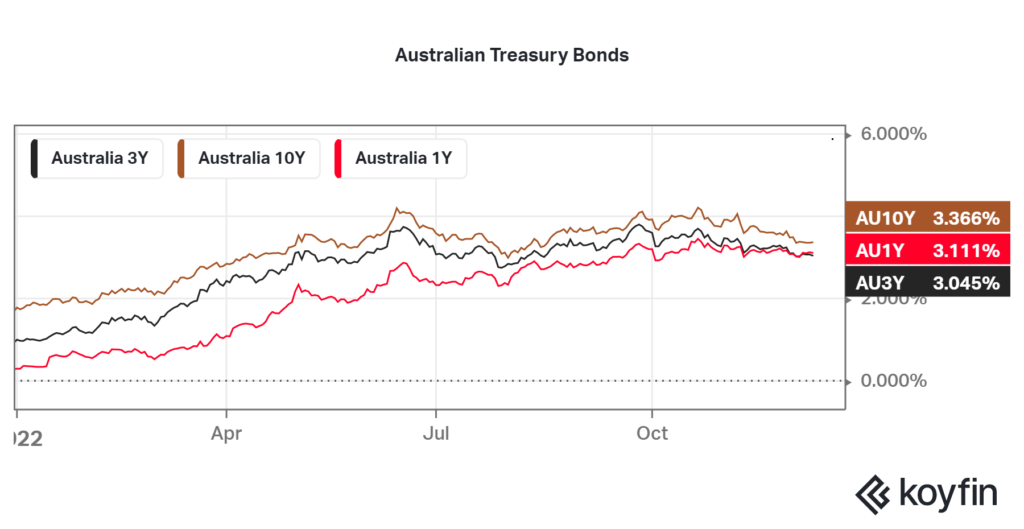
This fall in longer term interest rates has created a fillip for share prices with the ASX up more than 10% since those June lows.
Our concern is that currently the market is just pricing the lower interest rates, without considering the full impact of why those rates are lower, due to an expected recession. Analysts are still expecting positive Earnings Per Share growth in 2023. However history tells us that in an average recession, EPS fall about 29% peak to trough (US markets). When that starts to get factored in, the attention may switch from ‘hey interest rates have pivoted’ to ‘hey these company earnings are contracting rapidly’.
The hard part is knowing when the market might come to that realisation. Things happen quickly.
Being fully aware of the market mood and the probable risk reward scenario at any given point is an important part of building a portfolio that you can live with. More on that in a later blog.

Great article!’ Some interesting views