Ukraine
What can we say that you have not already heard! Probably the big thing to focus on here is the news over the weekend that Germany has finally joined the other nations who are committed to kicking Russia off the SWIFT banking settlements system. This is probably the biggest blow that could be delivered without firing a single shot. Germany’s reluctance was due to its energy reliance on Russia. Some self interest was also evident in reports that Italy wanted luxury goods to be exempted from the sanctions on Russia. If that is not the most ‘upside-down’ thinking I don’t know what is! Can’t be denying the oligarch’s wives and daughters their Gucci handbags can we?
If the Western world does unite to switch off Russian banks from the SWIFT system, it is almost certain to entrench the current high energy prices and resulting high CPI. At the same time, economic growth will be crimped. This is ‘stagflation’. Voices of authority are suggesting that it will be unlikely that the European Central bank will be able to raise interest rates in this environment. The US is also more likely to turn dovish again, calling into question the pace and magnitude of expected interest rate rises.
Gold
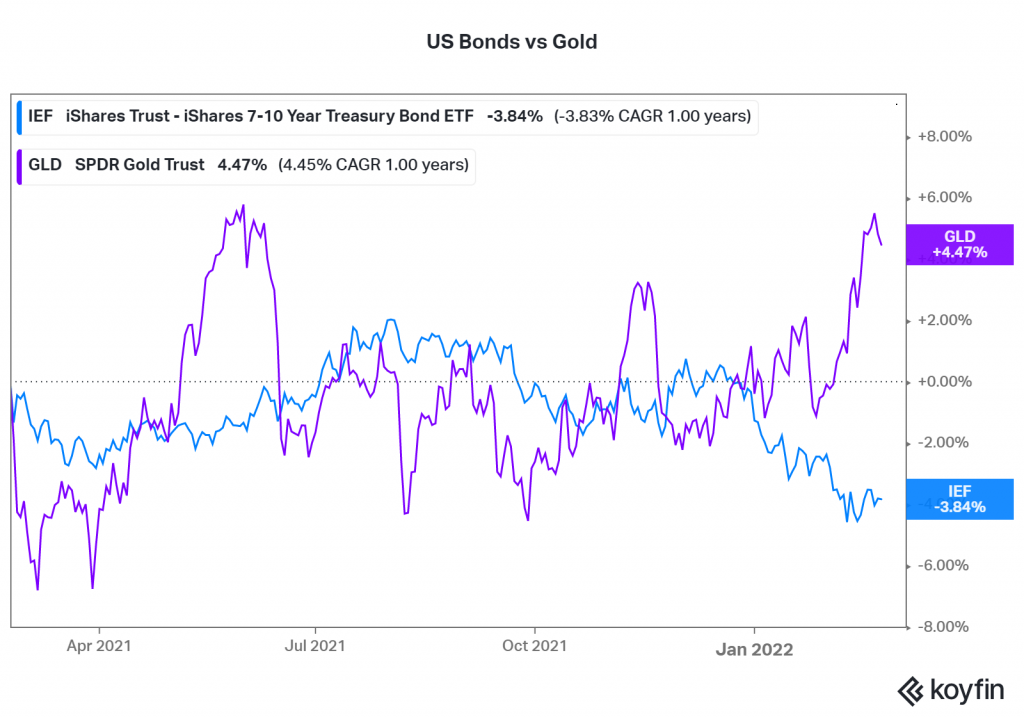
Turning to markets, at face value the most disappointing asset has probably been gold. The commodity usually responds well to two things; negative real interest rates and geopolitical uncertainty. We have both in spades! On 24th of February, gold opened at $1908 per ounce, and then shot up to $1974 shortly after. But it didn’t hold, and by the end of day had fallen back to $1,902 – six dollars an ounce below the start of the day. Still, before we judge too harshly, it is worth considering the performance over one year versus the other safe haven, US Treasury bonds. Over the last year gold is up 4.82%, versus an investment in US Treasury Bonds which are down by 3.84%. My thoughts are, keep buying any dips in gold.
Sharemarkets
Last month when we posted an update in the middle of a savage 3 week market sell off, we provided a chart of the put/call option ratio showing an extreme reading, which usually marks at least a short term low. Within days, the markets did indeed bottom, and we saw the beginning of a rally. Similarly, following the invasion of Ukraine, and a spike down, our email bulletin identified the probability that might mark a bottom. On Thursday the 24th of February, the S&P500 opened 2.57% below the previous day’s close, but then started a rally that saw it rise by 4.00% on the day, and then add another 2.25% on Friday.
Zooming out a bit we can see that the S&P 500 and ASX200 indexes hit all time peaks on January 3rd, and January 4th respectively. The more “growth” oriented Nasdaq index actually peaked back on November 19th and then tested that level again on the 27th of December.
Some of the market results since the start of January are:
Nasdaq 100 -14.37%
S&P 500 -7.83%
ASX200 -5.21%
Last month I also spoke about the choices within investments, and the emerging probability that we are starting to see the long awaited rotation from Growth stocks to Value stocks, and with it the probability that Active managers are likely to outperform market cap weighted indexes.
The chart below details the path and total return of three funds that are all focused on Australian top 200 shares. The Vanguard Australian Shares fund is down 5.09%; the Betashares RAFI (Fundamental Index) ETF is down only 1.25%, while the Wilson Active Leaders fund, a closed end listed investment company, is up by 2.39% over the same timeframe.
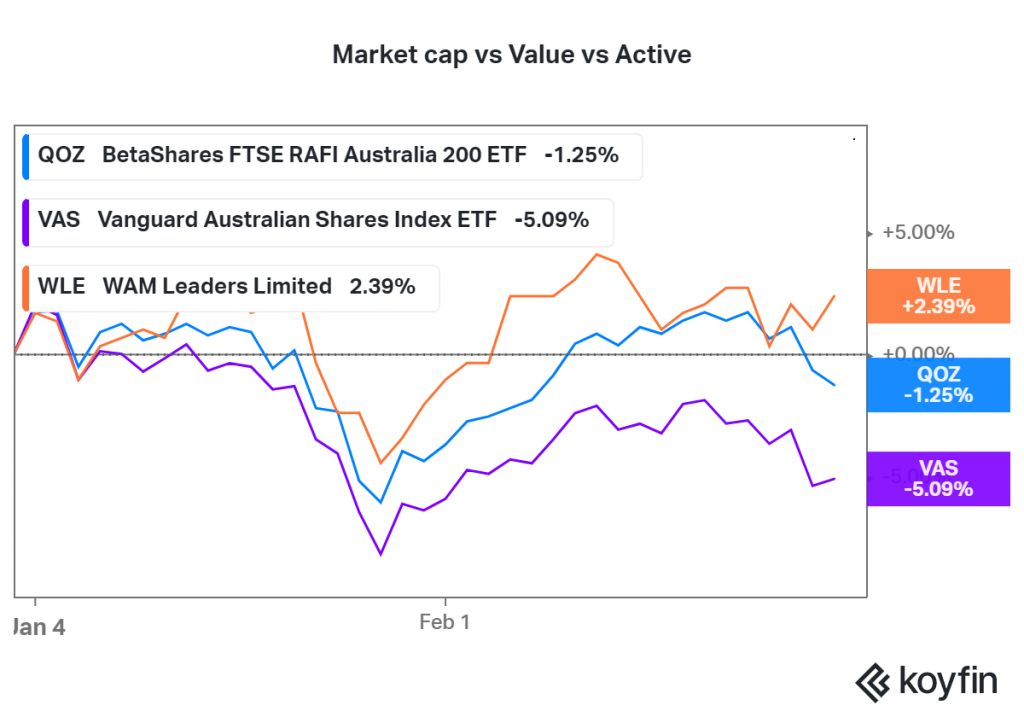
The market capitalization weighted Vanguard Australian Shares fund was down more than the Value oriented Betashares RAFI (Fundamental Index) ETF, and the best performer of the group is the actively managed Wilson Leaders Fund. The Wilson Leaders fund is an example of active management preserving capital in risk off situations.
Commodities
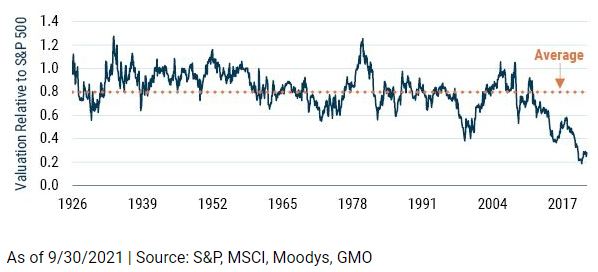
One of the winners out of the current market environment is Commodities. Importantly, although commodity prices are already confirming this, the price of shares in commodity producers are still way below the long term average. The chart below shows the sverage P/E multiple over the last 100 years was around 0.80 of the S&P500; it is now below 0.30. If that doesn’t give us confidence in the sector I don’t know what would! It is no surprise then, when you are buying the Value factor, you are getting more of these profitable commodities producers.
This also comes with a caveat. Do not be surprised if following a breakthrough of some kind in the Ukraine situation, that we get a deep sell-off in oil, gas and gold. That is to be expected. But the fundamental facts remain. Not enough money has been spent on oil and gas field development, and although everyone is looking to the future of wind, solar and hydrogen; total oil and gas usage is not declining quick enough to offset depletion in existing reserves.
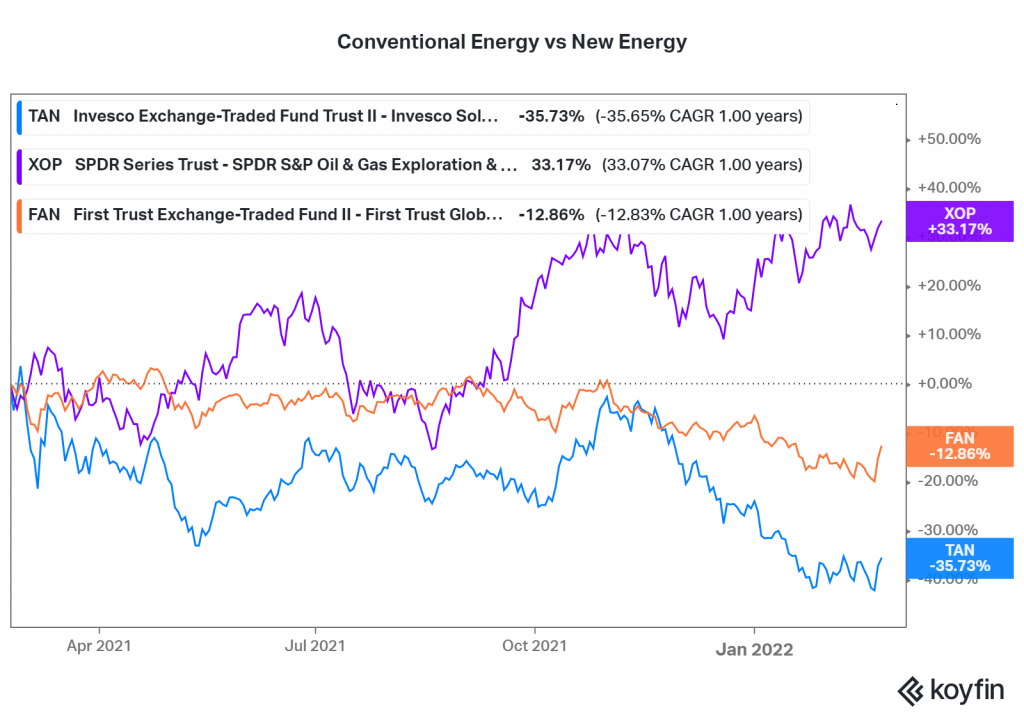
In the next chart for today, please consider the divergence between oil and gas companies, and those in the solar and wind energy sectors. XOP is the iShares Oil & Gas explorers and producers ETF, while TAN is an ETF of companies involved in Solar Energy, and FAN is the same thing for Wind Energy. Greta would not be happy! (don’t get me wrong, I am for carbon reduction, but in a rational way, not an emotional way)
Bonds and Credit Spreads
Although share markets have rallied late last week, I don’t think we can take that as an all clear to expect that the low is in for the year. Credit Spreads and Volatility are still a big consideration as a leading indicator of economic conditions and market expectations.
A ‘credit spread’ is the difference in yield (total return) between a risk free government bond of the same maturity as the bond issued by a non-government entity. To build out the understanding a bit more, in our first chart below we have the credit spread for the 5 to 7 year duration investment grade corporate bonds in America.
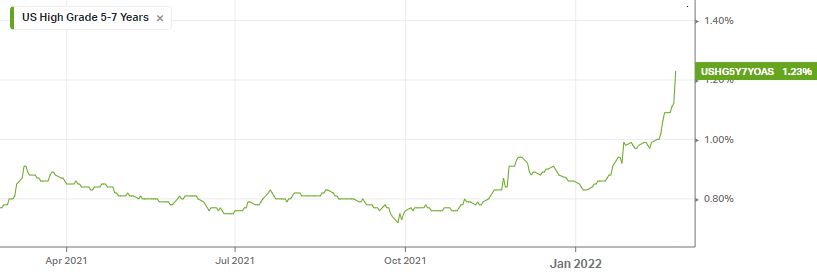
As you can see, the spread has widened sharply this year, rising from 0.83% above treasury bonds, to 1.23% on Friday 25th of February.
This rise has come from two factors, the rise in yield on the Treasury bonds of the same maturity, and the widening in credit spread. The credit spread is effectively the ‘risk’ premium that you get for buying bonds whose guarantee is only from a company, versus a guarantee from the government.
In the next chart we show the actual yield or ‘current return if held to maturity’ for the same bonds.
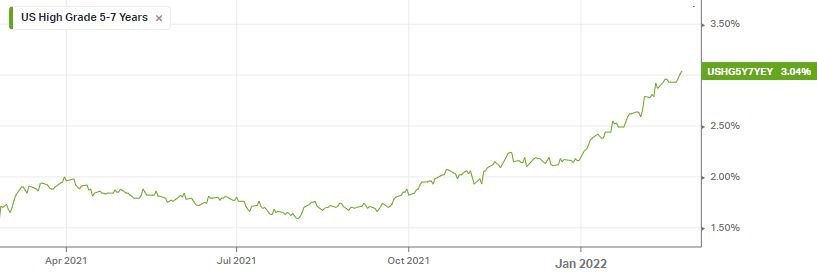
The chart tells you that buying a portfolio of investment grade bonds today will give you a return if held to maturity of 3.04% p.a. Only six months ago, that yield to maturity was only 1.59%
But what does that change in ‘yield’ do to an existing investor?
The next chart tells us the story.
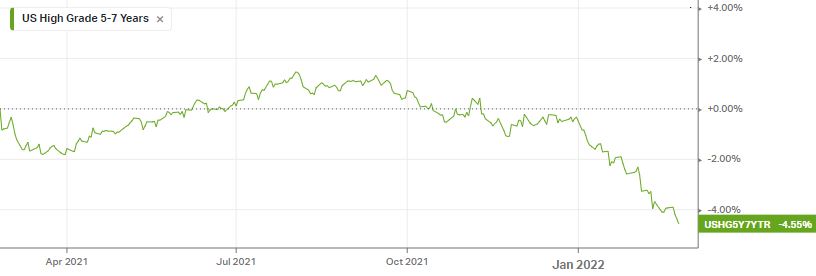
That increase in the yield to maturity and the increase in credit spread has resulted in a valuation change of -4.55% over the last year. Not good. But from today’s perspective, the go-forward return expectation is 3.04% per annum.
How does that affect us? Well, for one thing, this ‘credit spread’ is the effective signal for how risky certain parts of the bond market are becoming according to the sum total wisdom of all the players in the bond market. It is also dictated by flows into and out of the bond market.
Over the last two months there have been net outflows from Corporate Bond funds, and when there are more sellers than buyers, the price goes down.
Given the uncertainty over Ukraine, higher inflation, and possibly higher interest rates on borrowings, it is not surprising to see corporate bond spreads widening. Relating this back to share markets, it was interesting to observe that in spite of the strong rally for equities on Thursday and Friday, there was no corresponding retracement in the credit spreads. The bond investors are no doubt the more cautious group, and to me it indicates more risk ahead and potential for a deeper sell-off in shares.
Conclusion
If you stuck with the story this far you deserve some good conclusions.
We still believe many companies in the Technology sector have further to fall. However, in the short term, a change in the interest rate expectations may give them a brief reprieve. Longer term they still look expensive.
Energy and Commodities producers are still cheap relative to history, and if this inflation cycle is anything like the 1970’s then Commodities will be a winner.
Growth stocks outperformed Value stocks for the last 14 years. Value has been outperforming Growth for only 3 months. The last time the cycle turned, Value outperformed Growth for 7 years.
Interest rates may not go as high as the current futures markets are implying. Any marked change in narrative from Central Banks will result in a broader equities market rally. Use that to reposition where needed.
Non-residential property with long leases to credit worthy tenants will remain well bid.

Great article!!