Returns from US Large Cap equities over the next 10 years will be lousy. Bonds will struggle to do any better.
It is no secret that share markets, generally speaking, are expensive compared to their long term history. So, what are we to do about that? Does it mean we need to prepare for another crash? Does it mean we should avoid shares altogether?
Please take the time to follow this story, as it speaks to many of my concerns and cautions, and gives you an insight into what I am thinking about when investing.
Let’s start with the US share market. The S&P500 index measures the top 500 shares in the USA by market value. The market value of those shares is close to all time highs. One way to measure the valuation is by price to earnings ratio. For more on that, jump over to my earlier blog HERE:
At the end of March 2021, the forward projected price/earnings ratio of the S&P500 was 21.9 times. For historical perspective, the figure just prior to the COVID-19 sell-off was 19 times, and prior to the 2008 crash was 14.8 times. In 2000 just before the ‘tech wreck’ the S&P500 was trading at 24 times prospective earnings. In that context, and with much lower rates now, the market could continue going up strongly for some time yet. Certainly interest rates are much lower now than in 2000, when you could earn 6.2% p.a. just by investing in 10 year treasury bonds. The current low yields do create an environment that may justify these current higher than average P/E ratios.
To eliminate some of the annual cyclicality in calculating P/E ratios, Robert Shiller came up with what is now commonly called P/E 10. It is basically the last ten years of earnings averaged out. Currently the Schiller P/E 10 stands at 37 times.
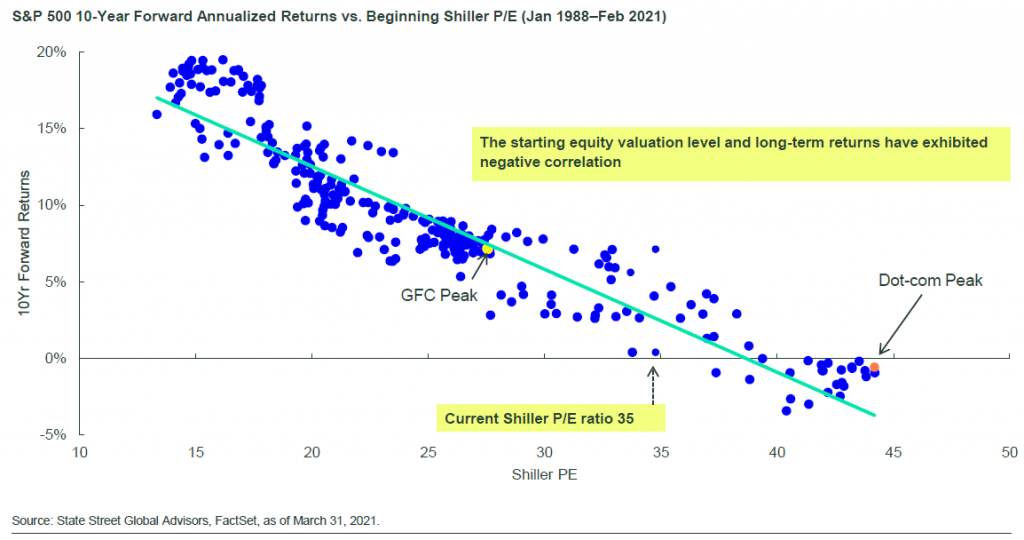
Now, while the Shiller P/E is not a great timing tool in terms of predicting a turn in the markets, it does have a very strong correlation when considering what will happen over the next ten years. In the chart below we have a scatterplot of starting Shiller P/E 10 ratios on the horizontal axis and the subsequent 10 year returns on the vertical axis.

Note that when the Shiller P/E 10 ratio has started a period above 38, it has never produced a 10 year return that was above 0%.
Today we are somewhere between Shiller P/E 35 and Shiller P/E 37.
Now, there have been some occasions when we had a high Shiller P/E of 35 or so, and we then got a 10 year return of around 5%. But if the future return is in line with the linear regression shown above, we can expect returns of maybe 2.5% to 3% p.a. from the S&P500 cap weighted index.
On this basis you can see why I don’t think buying a plain vanilla ETF just because it has low fees is going to be a great solution for investors going forward. Also it explains why we need to dig a lot deeper to find better value and return prospects than blindly joining the ETF bandwagon.
Now, please don’t think that I am against ETF’s or that I get paid something to recommend active funds. I do use some ETF’s and I am a great fan of SOME of the Factor based ETF’s that are available now. But even within sector and factor ETF’s there is some very misleading labelling going on right now, and I hope to touch on that in a future blog.
The takeaway is that we need to be cautious and targeted in our investing.
