Some months are just plain boring.
Some months there is just too much to try to get into one story without running to 20 pages and then losing the plot. This month we need to start with a laundry list of the issues we are facing.
- Interest rates going up
- Energy Crisis
- Inflation rising
- Credit Spreads widening
- Yield Curve inverting
- Sharemarkets – surprisingly sanguine
- Shanghai – in lockdown and about to explode
- Transportation index falling off a cliff
- Rioting in third world countries
- Russian war crimes
- De-globalisation
- Federal Election
Although the list is long, and although I have put Russian war crimes at number 10, I believe that we would all gladly accept higher energy costs, inflation, lower sharemarkets, and other personal deprivations if we could bring an end to the tragedy in Ukraine. We hope for a resolution there, even if that hope seems unrealistic at the moment.
The fact remains that although the Russian invasion of Ukraine was the catalyst that ignited the final stage of the energy price rocket, the fuel tanks were already full and at flash point temperatures.
Mismanagement of the TRANSITION to zero carbon is the underlying issue. Brent Crude prices were already up 51% during 2021. Supply issues have been building since most western governments and banks made it an impossible task to continue to bring any new fossil fuel projects into production.
Remember, this is a TRANSITION to clean energy. In their rush to the moral high ground, policy makers have ignored the detail of how to avoid an energy crisis as we make a gradual transition.
Oil supply is not keeping up with demand growth. While first world economies are making some headway in reducing energy consumption, in developing countries the rising demand is a natural outgrowth of their movement up the economic ladder.
Why am I so focused on energy? Because energy is an input cost to almost every product you manufacture or grow or transport. Plastics, fertilizer, grains, meat, steel, the list goes on.
The knock on effect of sanctions on Russia is creating a wave of economic impacts through higher energy prices. My list included rioting in third world countries. Peru and Sri Lanka are in the midst of riots that have many underlying issues, but the final spark was energy prices. Lebanon, and soon most north African countries will also be seeing critical food shortages.
As the economic powerhouse of Europe, Germany faces a no-win decision of turning their back on Russian energy and seeing many industries grind to a halt, or finding rubles to pay Putin for energy at a rate that dwarfs any direct aid they are providing to Ukraine.
Why the fixation on Energy?
There are two signals that precede most recessions.
- Spiking energy prices and; 2. Inverted Yield Curve.
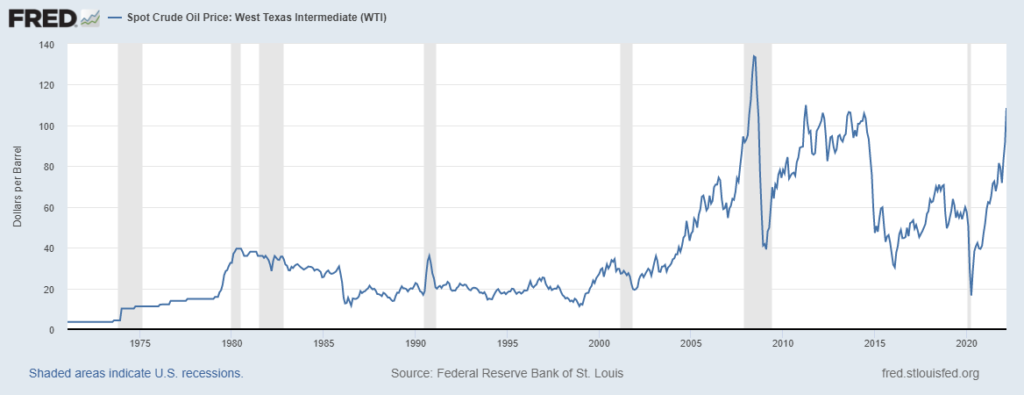
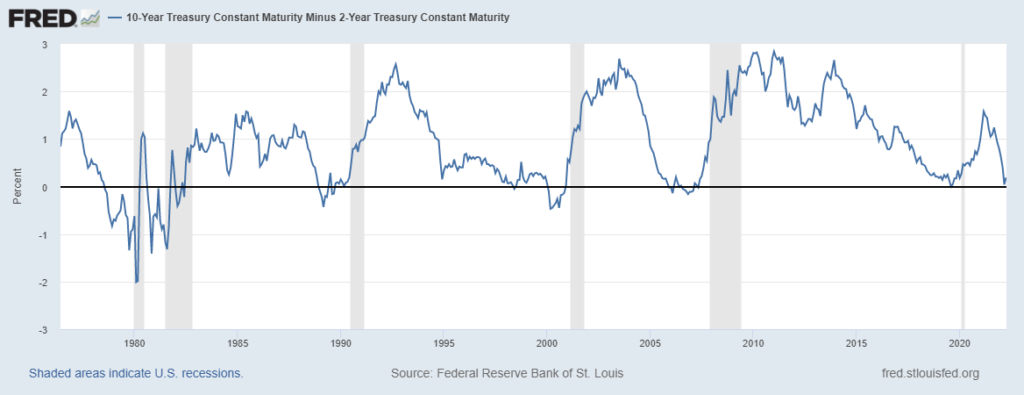
In chart 1, we show the price of WTI crude oil. The shaded bars represent recessions in the US economy. Chart 2 shows the difference between the yield on a 10 year US Treasury Bond, minus the yield on a 2 year US Treasury bond. When the difference is a negative number, then the yield curve is said to be ‘inverted’. IE; the opposite of what you would normally expect, that the longer term interest rate would be higher due to uncertainty about the future rates of inflation.
Should we be worried about a recession? Yes. A recession is likely to knock about 20% off share prices, and maybe up to 30% or 40%.
Are we predicting a recession? That call is a lot harder, and the timing of such a call is far more difficult. The share market at present seems fairly sanguine about the prospects of a recession. Certainly we have seen markets come down a bit as one would expect. But in the main it has been expensive growth stocks that have taken the brunt of the sell off. Energy, Materials, Financials, Consumer Staples and REIT’s have all done pretty well.
When we look back at the history of the previous episodes of higher energy prices and inverted yield curves, we see that the lag time is generally 6 to 18 months until a recession.
At the moment, the markets seem to be willing to call the bluff of an inverted yield curve.
And, if we look at all Fed tightening cycles, we see that in the first 12 months, on average the market can still eke out a positive return.
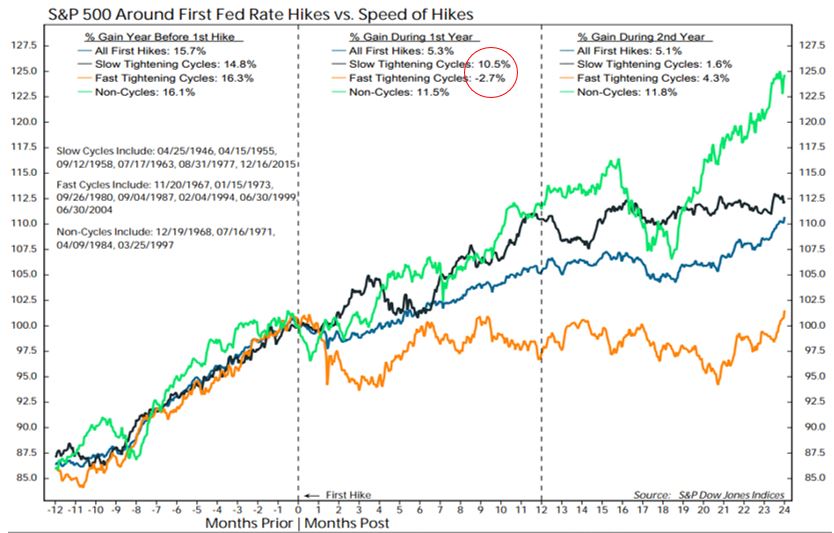
In chart 3 we look at the average S&P500 returns from the first Fed rate hike. The black line is a Slow tightening cycle. We don’t think this will be slow. The Fed narrative has moved to a mood of ‘shock and awe’ although we still think the magnitude will be more limited. A Fast rate hiking cycle is illustrated by the orange line. As you can see, in the first year of a fast rate hike cycle, the average return was negative by 2.7%. There is every reason to believe this will be a fast rate hiking cycle.
So, what should an investor do?
I have been banging the drum for quite a while now about the rotation from Growth Stocks to Value stocks. Some of the charts I have shown previously included the fallout following the 2000 Tech Bubble, and the outperformance of both active managers, and the Value factor in general.
This month I am adding a new chart to the stack of evidence of the safest place to be in an inflationary environment.
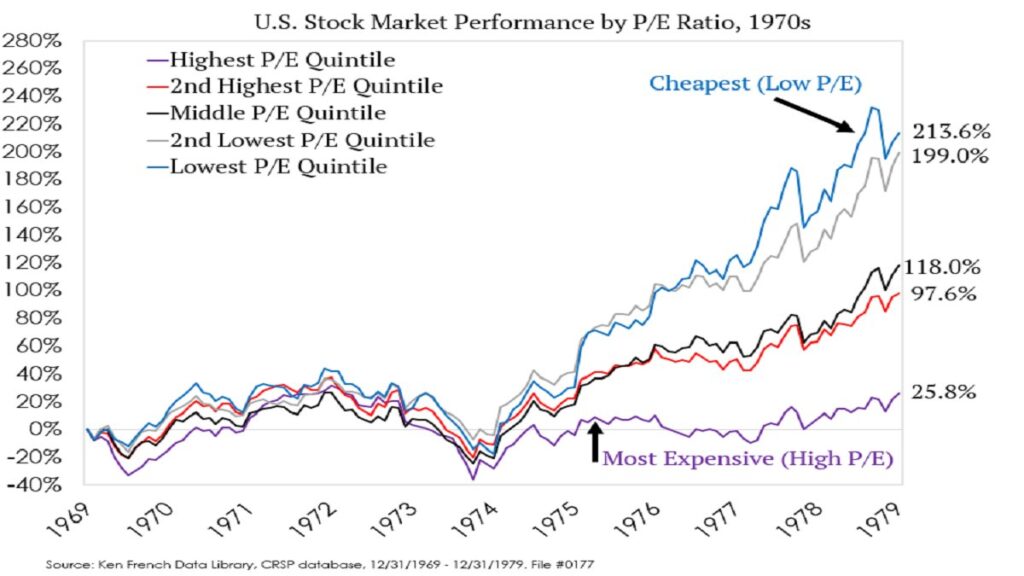
In chart 4 with (credit to Ken French’s data library) we have the US sharemarket broken down into 5 quintiles. The Cheapest 20% of stocks measured by Price to Earnings ratio, (lowest P/E) up to the Most Expensive P/E multiple.
We see that in the 1969 to 1972 bull run they tracked similarly. As stocks sold off into the 1974 bear market low, it was the second cheapest P/E cohort that did the best, though all sectors declined. However, as we ran through the high inflation mid to late 70’s the cheapest P/E ratio stocks outperformed by a wide margin.
What does that mean for us? The Value factor in equity markets is likely to perform best in a higher inflation and higher interest rate environment. Value managers, like Platinum, Investors Mutual, Allan Gray, may start to outperform the indexes. The Value factor in a broad cap Australian ETF is available via the Betashares QOZ.
Certainly, an awareness of this outcome is driving our current asset selections.
So what about Fixed Income?
In the last blog we outlined the issues and headwinds faced in fixed income markets. Rising interest rates and widening credit spreads both pose a risk of negative returns to investors. Indeed, bond markets globally have had their worst quarter since 1994. By some measures the returns have been even worse than that. The US Aggregate Bond index is down 7.67% since the start of 2022. The International Aggregate Bond index is down 5.93%. Investing in the Vanguard Australian Fixed Interest ETF has lost you 6.34% since 1 January.
We mentioned that as interest rates rise, the present value of a fixed series of income payments declines. Although not resulting in a permanent capital loss (unless you sell), it is a reminder that you are going to have to wait longer to get your capital back, and then only at the rate that was being offered when you bought into that security or portfolio of bonds.
Likewise, even if interest rates don’t rise, an increase in the ‘risk premium’ investors demand to lend money to a non-government entity has an impact on the price of existing securities.
On 31 December 2021, the extra yield (income) demanded for a BBB rated corporate bond was about 1.20% above the rate on a similar maturity government bond.
By 15 March that extra yield demand had grown to 1.85%. Combined with increasing rates on the benchmark government bond rate, the widening credit spread was an extra hit to valuations.
The change in value was -8.19%. However, as stated earlier, the loss is not permanent, it is simply a ‘mark to market’ loss. A buyer of that bond today (11 April 2022) gets a 4.10% yield to maturity, whereas the person who bought on 31 December is only going to get a 2.6% yield to maturity.
There will come a point, and it may be soon, that those fixed rate, higher grade corporate bonds, will be a buy if we sense that the interest rate cycle has peaked. It is a bit too early for that.
Floating Rates
The particular assets we mentioned last month were floating rate, senior secured, non-investment grade bonds, as well as private credit and direct first mortgages.
Examples in this space include the Invesco Senior Secured Floating Rate fund. This one has a yield to maturity of 5.1%. It is almost entirely in floating rate loans. Although the manager has to constantly revalue the loans in line with similar bonds, the main risk here is widening credit spreads, and not rising interest rates.
Two other funds of note are the Ares Global Credit fund and the Ares Diversified Credit Fund. The former is open to wholesale and retail investors, where as the latter is only available to accredited wholesale investors. Ares are a well credentialed global debt provider, managing over $167 billion. They have an impeccable track record in mitigating loan losses. By way of example, in one segment of their lending, US Junior debt, their average loss rate is 0.03%. In contrast, the average US loan loss in Junior debt is 4.12%. The yield on the Ares Diversified Credit is around 6.9% at present, while the lower risk Ares Global Credit fund has a yield of around 4.5%.
Other private credit providers include Metrics Credit, and Partners Group Global Income. While Metrics are more focused on leading loan syndicates for Australian borrowers, the Partners Group have a global reach. Both managers have listed as well as unlisted access to their funds. The listed versions can trade at a discount or premium to the net asset value. We like to buy things at a discount, but also acknowledge that it can be disconcerting if the discount goes on for too long. Both of these offer yields in the 4% to 5% range, and the Partners Group is forecasting a total return to maturity over three years of around 11% per annum.
Finally, we also have funds from Centuria Bass, Moelis Australia, Qualitas and Balmain that enable various levels of lending to property projects. Some of these are collectives where we have to put trust in the aggregator to make the right choices, and others like Balmain allow us to pick and chose the investment we are funding. All of these provide income between 5.5% and 7% per annum. Some are floating rates, and some are fixed.
Conclusions
We are likely to see continued volatility in equities. Downside is to be expected with the headwinds that we see in the economy, and which is evident in the inverted yield curve.
Value equities, where current income is high and we don’t have to wait for elusive growth, are likely to perform better in this environment.
We can find higher rates of return in some floating rate interest investments that remove some of the ‘duration risk’ however there is no free lunch, and these are still exposed to some credit risk in a recessionary environment.
Thinking outside the box and building a portfolio of uncorrelated assets is likely the best defense in these difficult times we face.
Prologue
I have not even got to the topics of what is happening in China. This could wreak new havoc on global supply chains given that the whole of Shanghai is locked down till May 7th. That is feeding into the Dow Jones Transportation index, which has plunged 12.6% in the last 8 days. De-globalization is underway, and as each country becomes more internalized, productivity goes down, and cost of goods sold goes up. On the election question, I have been asked ‘what happens if Labor wins the election?’ Frankly, I think there are much stronger winds blowing on us from the global economy than whether or not Mr Morrison or Mr Albanese is in the Lodge.
The last election was on 18 May 2019. The Labor party was widely tipped to win. The Coalition win was actually a big surprise. I drilled into the results to see if any market sectors reversed course and made big gains. The only sector with any significant move was the Banks. In the week prior to the election the banks were down 5.43%, with investors expecting that Labor would eliminate refunds on excess franking credits. Following the surprise Coalition win, the following week saw the banks up 8.12%.
Other sectors that were in uptrends before the election continued their uptrends. If I get any detailed research on individual company winners and losers under Coalition or Labor I will be sure to let you know.
Stay safe and diversify!

I enjoyed that Mark. Thank you.