We are just four steps into a US Federal Reserve rate hiking expedition.
Already the heat is being felt in share markets and property markets as investors come to grips with higher borrowing costs and analysts re-hash their fair value models for company shares.
As a primer to the interest rate markets we must start with an understanding of who controls what?
Central banks generally have the lender of last resort role. As such they provide short term liquidity to banks and select other money market dealers. With this function, Central Banks control short term overnight cash rates. They normally do not control longer term rates unless they decide to get involved with what is called Yield Curve Control. (YCC) The Reserve Bank of Australia did just that for the first time in the COVID19 crisis period, promising to keep the 3 year government bond yields pinned at 0.10%. We discussed that in this blog: https://retirementconsulting.com.au/yield-curve-uncontrolled/ In Japan there have been forms of YCC going on for decades which has kept 10 year bond rates close to zero.
But in the main, central banks control very short term interest rates, while the ‘market’ meaning banks, insurance companies, some hedge funds and others who buy and sell bonds set the price for longer term money. Right now, most Central Banks are on a path of interest rate hikes.
Don’t fight the Fed
Back in 1987 Marty Zweig coined the phrase, ‘don’t fight the Fed’. The message – when the Fed is raising interest rates, be cautious about owning shares. Likewise, once the Fed starts cutting rates, ignore the noise and any overhanging bad news and start buying. Marty had some other factors that he used for his trading, outlined in ‘Winning on Wall Street’. For some context on Marty’s prescient call, check this video from the Friday before the 1987 crash. https://youtu.be/2MyToTwag34 especially from minute 6.30 onwards.
History and the Fed Cycle
In my recent research I came across a statement that bear markets don’t bottom (ie; stop falling) until between 10 and 41 months AFTER the peak in an interest rate hiking cycle. The source didn’t show any table of history, so I decided to dive into it myself.
US Fed cycle/Stock almanac
Looking at Fed rate cycles is not as straight forward as it might seem. Sometimes, there are mini rate cycles within a bigger decline in rates. We have eliminated those which appeared to be irrelevant cycles of minimal magnitude. I think everyone agrees, the current rate cycle is a significant one.
Also of note is that we used month end data in our detail of stock market returns. The intra month movements would have been worse at the extremes.
Additionally, in the table we have noted whether the rate hiking cycle resulted in a recession. This is important for later on when we consider the Inverted Yield Curve.
| Fed Funds significant rate cycle peaks and date of last hike | S&P500 events (month end data) | Rate peak to market bottom (months) | Recession? |
|---|---|---|---|
| Sept 1957 rate peaks at 3.50% | S&P 500 makes a low at 40 in December 1957 after falling 20% since May 1956 | +3 | Yes |
| October 1959 rate peaks at 3.98% then falls to 1.45% by January 1961 | S&P 500 makes a low at 53.39 in October 1960 after falling 14% since July 1959 | +12 | Yes |
| November 1966 rate peaks at 5.76% then falls to 3.79% by July 1967 | S&P 500 peaked in Jan 1966 at 92.88 then falls 19.8% to 76.56 by September 1966, two months before the Fed funds rate peak. There is no recession in this cycle. | -2 | No |
| August 1969 rate peaks at 9.19% | S&P 500 peaked in Nov 1968 at 108.37 then falls 33% to 72.72 by June 1970 | +8 | Yes |
| After rates hit a low of 3.72% in Feb 1971, the Fed starts a new ‘mini’ cycle that takes rates back up to 5.57% in August 1971 | S&P 500 peaked in April 1971 at 103.95, then falls 9.6% to 94 by November 1971. No recession in this cycle. | +3 | No |
| The big recession hits in 1974. Fed raised rates to 10.78% by Sept 1973, then flinched and cut back to 9% by Feb 1974. They were not done, and in the midst of the recession took rates up to 12.92% in July 1974 | S&P500 peaked at 118 in December 1972. It then fell 46% with very little relief to 63.54 by September 1974 | +12 or +2 depending on how you count this cycle | Yes |
| Inflation was not dead. The Fed increased rates from a low of 4.61% in Jan 1977 to a peak of 17.6% in April 1980 | S&P peaked at 114 in January 1980 then fell 10% to 102 by March 1980 amid a short recession. At that point, the S&P 500 had gone nowhere since 1968 and was trading at 6.7 times earnings. | -1 | Yes |
| After cutting rates to 9% in July 1980 to end a recession, the Fed went again, lifting rates to 19.1% in January 1981 | The S&P 500 fell back to 107 by July 1982. This set the stage for the end of the bear market since 1968, a 14 year period of virtually no returns other than dividends. | +17 | Yes |
| Rates were cut from the January 1981 peak to 14.7% in March 1981, but then went back to the 19.1% peak in June 1981 | Same bear market as above, final low in July 1982 | +13 | Yes |
| Mr Volker was not yet done, and provided another ride on the rates rollercoaster with an increase from 12.37% to 14.94% in April 1982 | The third rate cycle in this bear market saw sentiment very washed out heading for the final low in the cycle | +3 | Yes |
| The next rate hike cycle ran from Feb 1983 to August 1984 when rates hit 11.64% | From a high in Jun 1983 at 167 the S&P fell 10% to 150 in May 1984 – a mere correction and stocks were cheap at 9.6 times earnings. No recession in this cycle | -3 | No |
| Rates fall to 5.85% in July 1986 then rise to 7.29% in October 1987 | The S&P hits 329 points in August 1987 then falls to 230 points by November 1987 a tradeable low. No recession in this cycle. | +1 | No |
| The next notable cycle is March 1998 (6.58%) to the peak in March 1989 at 9.85% At the time of the peak rates the S&P 500 is at 294 points | The S&P has been climbing through 1988 and 1989 with minimal market impact from the actual rate hikes. There is a recession in 1990 and the S&P peaks in May 1990 at 361, and falls to 304 in October 1990; above the level where the rate cycle peaked | N/A | Yes |
| Next cycle peak is in Apr 1995 after a bond rout. Fed funds peak at 6.05% | Equities hit a low of 444 in June 1994. Even as rates are rising in 1995 they ignore this and rally throughout – there is no recession in this cycle | -14 | No |
| In June 2000 the Fed funds rate hits 6.5% after an 18 month hiking cycle. | The S&P 500 bottoms at 815 in Sept 2002 down 46% from the peak in Aug 2000 | +27 | Yes |
| In August 2006 the Fed funds rate is back up to 5.25% after rising steadily from 1.00% over 26 months | The S&P 500 peaks in Oct 2007 and then declines until March 2009 | +31 | Yes |
| January 2019 ends the next cycle at 2.5%. Rates have risen from near zero over 38 months | S&P peaks in September 2018 and falls 20% in three months to bottom out in January 2019 | +0 | No |
There have been sixteen major US Fed rate hiking cycles in the last 65 years. Only ten of these resulted in recessions.
Minimum, Maximum, and Average time from Fed rate cycle peak to the bottom of the bear market.
In these ten cycles, where there was a recession, the shortest time to market bottom was -1 month.
That is, the market actually bottomed in March 1980, one month before the April 1980 final rate hike in that cycle.
The maximum time from the last rate rise to a sharemarket low was 31 months from August 2006 to March 2009.
The average time from the last rate hike to the final low in the markets was 12 months.
Given that the US Fed is almost certain to raise rates in September and again in November, on average we might conclude that the bottom of the current market downturn may not occur (using history as a guide) until December 2023.
Recession Indicator – the Inverse Yield Curve
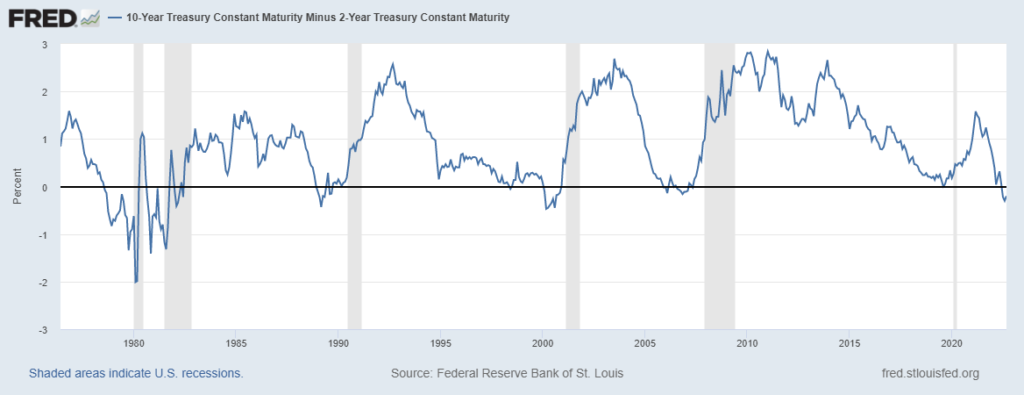
I have previously written about inverted yield curves, and what this means. As a refresher, it occurs when long term interest rates are BELOW short term interest rates. The US yield curve was briefly ‘inverted’ in April 2022 and since July 2022 is again in inverted territory. The chart below shows the history of inverted yield curves. When the chart line drops below 0, it indicates the amount by which the 2 year US Treasury Bond is above the US 10 year Treasury bond.

As you can see each dip into negative territory has correctly predicted the recession that followed, shown as grey bars.
So, if an inverted yield curve implies a recession, what is one to do? It may seem natural to sell everything and hide in cash and short term deposits or short term government bonds. However, the path to a recession and the path of share markets are extremely hard to predict. For example, in 1978 the yield curve first went negative in August, and the recession did not officially start until January 1980, a full 31 months later. In addition, the US market capital gain was 9.1% over that time so selling out would have been a wrong move, even though the yield curve correctly forecast the recession.
Your situation is unique
Our long time clients understand that we don’t publish click bait. On the other hand, we don’t ignore or play down the reality that markets have cycles. After 33 years of experience I have come to understand the truth in John Maynard Keynes statement that ‘the markets can stay irrational longer than you or I can stay solvent’. Experience teaches us that markets can be confounding for both bulls and bears.
For each investor, the portfolio implications will be unique. My own portfolio continues to hold companies and funds that I like and am convinced are good value, though I am also holding more cash than normal. Others deploying new cash may chose to be more patient. Raising cash levels while holding a core of quality equities may help alleviate some stress. For others, knowing how difficult it is to pick market bottoms, the choice may be to stay fully invested.
If you have concerns or want to check in on your current market exposures, please give us a call to discuss what is the best thing to do in your unique situation.


Very interesting Mark, I would hope you and our managers will invest at our comfort level.
Regards Bill
Very interesting