Share markets have posted solid returns in the financial year ended 30 June.
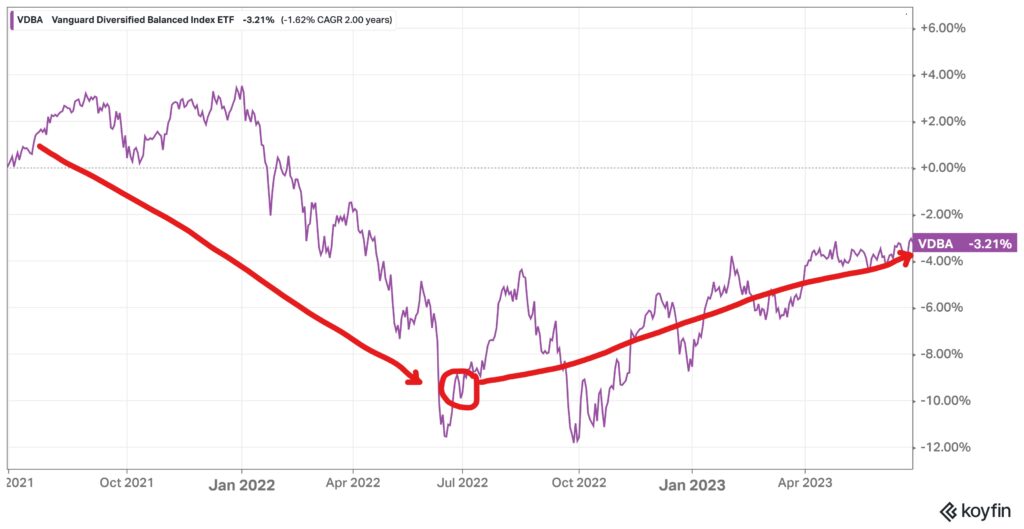
While the month of June 2022 was a shocker, where the ASX fell 8.25% and the S&P500 was down 9.37%, that low point became a springboard for a much better year starting on 1 July. For a little historical context, that 9.37% fall in June 2022 came as the US Federal Reserve pushed through a 0.5% increase in rates, to take the Fed Funds Target Rate to 1.50%/1.75% band. This had followed a similar surprise 0.5% jump in May 2022.
From that low point, international shares gained 22.42%, some of which came from the fall in the Australian dollar which lost 3.50% vs the USD, and 7.81% vs the Euro.
The Australian ASX200 gained 14.78% for the financial year.
However, despite the impressive recovery in international shares, it’s important to acknowledge that at 30 June 2023 the S&P500 index remained 7.22% below its peak from December 2021, and the EuroStoxx 600 was still 1.41% below its former peak.
Listed property trusts (also called A-REITs), experienced a partial recovery, gaining 7.49% for the year despite facing challenges from rising interest rates.
Within the fixed income sector, Australian Fixed Income assets delivered a modest return of 1.51%, with the rising interest rates putting pressure on the prices of long-dated fixed-rate bonds. In contrast, the global bond sector suffered a 1.16% decline, as measured by the Barclays Global Aggregate bond total return index (hedged into AUD). Combining all these returns into a typical balanced portfolio, the chart below illustrates the performance of the Vanguard Balanced ETF, including dividends, over the last two financial years. As evident, 2023 marked a positive financial year, but the overall markets were still striving to recover the losses incurred in 2022.

Forward Outlook
While it is useful to look at past returns, wisdom says that past returns are no indicator of future returns. In fact, poor past returns can be a happy hunting ground for what is likely to have a turnaround in the next year.
Australian shares have a current dividend yield (income payments) of 4.69% per annum, which one would expect is going to grow in line with the increase in aggregate corporate profits. As a side note, the ‘earnings yield’ is around 6.59%. This is the profit after tax, before dividends, that is earned on a dollar invested the ASX200 today. This implies that companies are paying out 71% of profits as dividends and retaining about 29% for future growth initiatives. The current ‘earnings yield’ is sitting right on the long term average going back to 1980, implying that the market is neither cheap nor expensive. The Lonsec 7 year forward return estimate for Australian shares is 8.3% p.a. with around half from dividends and half from capital growth.
The forward outlook for Fixed income has changed dramatically for the better. A three year government bond bought back on 30 June 2021 had a yield to maturity of only 0.42%. By June 30 2022 that yield to maturity had risen to 3.28%, and now at the end of 30 June 2023 the forward yield over the next three years is 4.04%. Add in the additional return available from investing in corporate bonds, and the forward yield outlook goes up to around 5.5%. Examples of funds in this space are the Vanguard Corporate Fixed Income ETF, with a 5.35% yield to maturity, and the Daintree Core Income fund with a 6.51% yield to maturity on an average credit rating of “A”.
Far from being something to avoid due to a poor performance of +1.51% last year and -10.59% the year before that, we see fixed income as finally being back to attractive levels on a forward basis. If one delves into the non-rated and sub investment grade sectors, there are yields on offer that exceed the forward expected return from equities.
Property. Few investments rival property for passion and variety of opinion on what is happening. We all need a place to live, so every household is affected in some way be property, even if they are not so interested in shares or fixed interest.
I won’t write too many words on the residential market. So far it has defied the headwinds of higher interest rates, no doubt assisted by a trickle up effect of so much international migration.
Commercial property too has many different factors driving it. Within the commercial sectors, it is Office space that has suffered most, while Industrial (particularly logistics) that has held up very well, and where rents have increased significantly.
One factor that is drives all commercial real estate sectors is interest rates. As long term rates go up, the ‘cap rate’ or required yield applied to property also goes up.
The ‘cap rate’ is short for Capitalisation Rate, which in turn is effectively the way of saying what price will the market pay for this level of net rental income. If a property has a net income of $100,000 and the market is applying a ‘cap rate’ of 5%, then the property is valued at $2,000,000. However, if due to an increase in the risk free rate of return, (10 year bond yields are up) and the market thinks that a 6.00% cap rate is the appropriate valuation level, then the market value drops to $1,666,666 a fall of 17%, just because the market now demands a 6% ‘cap rate’.
At present there is a push by APRA to have industry superfunds to apply more regular and transparent valuations to their large holdings of direct property. They have concerns that some of those assets may still be overvalued compared to actual sales of similar assets.
We have seen some asset write-downs in the unlisted property sector, with Charter Hall, Centuria and other operators of unlisted trusts writing down values at their 30 June balance dates.
Over in the listed world of A-REIT’s (Australian – Real Estate Investment Trusts) the market was much quicker slash prices. During FY2022 one measure of the Australian REIT sector was down 12.45%, before recovering 7.23% in FY2023. Listed property returns often lead un-listed. In fact, the listed property segment currently trades at a discount to net asset value, implying that there will be further downward revisions to values (cap rates going up) in the next twelve months. Some examples of current yields in the listed (A-REIT) sector are 6.85% for the CharterHall Long WALE REIT, 6.01% for the Dexus Industrial REIT, 6.89% for the HomeCo Daily Needs REIT, and a juicy 8.39% for the Dexus Convenience Retail REIT (The latter has a majority of assets in service stations, so you have to be comfortable that charging ports can replace petrol pumps to maintain the value of these properties).
Hard Landing, Soft Landing or No Landing?
Aeroplane landings have oft been used in describing the path when an economy is about to ‘normalise’ from an overheated level.
In October last year, we noted the Ned Davis Research Global Recession Probability index was reading 98% probability of a Recession in 2023. That, along with an inverted US Yield Curve, (where the 2 year yield is above the 10 year yield) has been a driving factor in our more cautious asset allocations. We are aware of how viciously the cycle can turn when things ‘break’. And in their newfound enthusiasm to fight inflation, central banks seem determined to ‘break stuff’ in their effort to rein in inflation.
Since October 2022 markets have started to factor in the possibility of a soft landing. Even the bank run in March 2023 that took down three US banks, was not enough to dampen animal spirits. As the rate of inflation stopped printing higher highs, and started coming in with lower numbers, (albeit still above the desired target), hopes of a soft landing and pause in interest rates hikes became the opium of markets everywhere.
Looking at the current state of the jobs market, a mere 3.5% unemployment rate in Australia, makes it seem that if there is a recession, it may still be some time away. Residential real estate remains very well bid, even if sales volumes are declining. Households, in spite of the mortgage squeeze, still have a decent pool of savings.
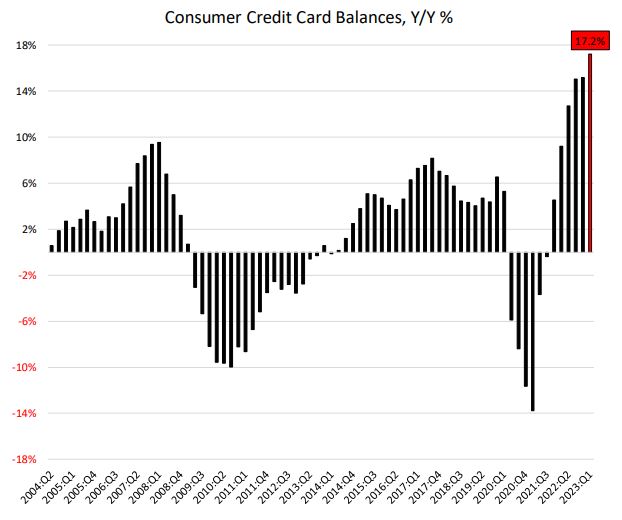
The US Federal Reserve recently published an article on the build up of ‘excess savings’ in advanced economies that was kicked off by the COVID-19 handouts. Their conclusion was that Australia had a better current savings buffer than most other advanced countries, except for Singapore, and recently France. They concluded that US ‘excess’ household savings will be largely depleted by the end of this year, and Australia perhaps sometime in the second half of 2024. In fact, the chart below shows that Americans have been hitting the plastic harder than at any time in the last 19 years.

US Credit card balances grew at a 17.2% year-on-year clip in the first quarter of 2023. That kind of rise cannot go on forever. Additionally, there is the looming end to the moratorium on Student Loan debt. The interest and repayments which were suspended in March 2020 are due to start accruing interest again in September, and payments will be due from October. Around 45 million people in the US have Student Loans and pre-COVID the average repayment was around $250 per month.
We could see a convergence of factors that will rapidly slow spending in the later half of this year.
Australia is in a somewhat better position due to population growth, which provides an ever-increasing pool of customers to existing businesses. However that comes with its own problems, not the least of which is a shortage of affordable housing.
The irony of all this is that if a recession does not come soon, interest rates may have to stay higher for longer, and investment markets may cycle through a few false dawns before we see inflation come back down into a more comfortable band. If we do get a recession, then credit spreads will widen, hurting both corporate debt values as well as sharemarket values.
Our personal preference is to maintain a reasonable level of cash and government bonds so that if there is downside, we have money to invest. Unlike prior periods, at least one can now get a decent return from safe fixed income as we watch for the impacts from the most aggressive hiking cycle we have seen since ABBA’s Money, Money, Money topped the charts.

