Stocks are in a bear market and with the energy crisis not improving, the odds are that many G7 countries are headed into a recession.
Investor and consumer sentiment readings are both very pessimistic. However it is often the case that extremes in bearish sentiment readings can coincide with a low in the markets. Is that the case now, and what are the analogues that we should consider?
Speed of the Rate Cycle
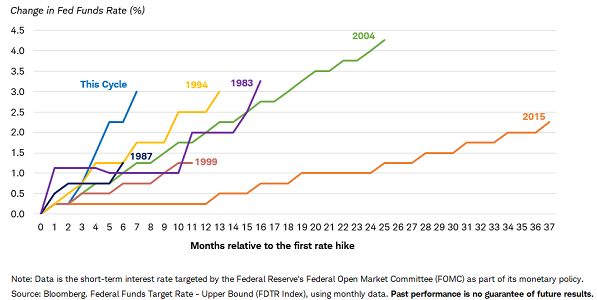
This rate hiking cycle is the fastest in at least 35 years.
The chart below shows the magnitude of rate hikes by the US Federal Reserve is faster than any of the previous six cycles.
Rate differentials drive currencies
The speed of that rate hiking cycle has driven the US Dollar up by around 15% over the last twelve months. This means that the value of other currencies declines by comparison to the USD.
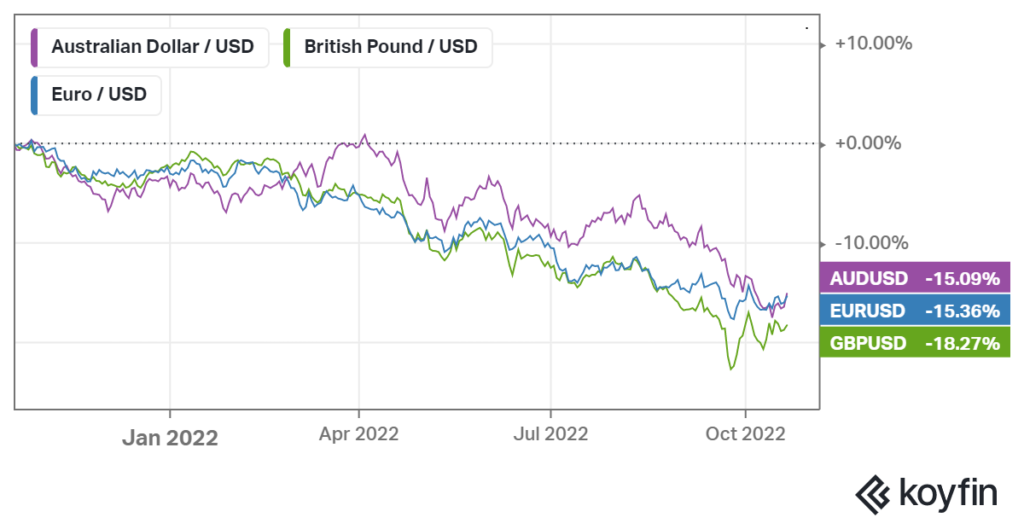
The British Pound is only slightly worse than the Euro and Australian dollar when compared with the USD.
This US Dollar strength puts pressure on many areas of the financial markets. A lot of commentators have recently been invoking the 1971 words of US Treasury Secretary John Connally who famously said of the US Dollar, ‘it’s our currency – but your problem’.
The trouble that markets are having with a rapidly rising US dollar is that money now has a viable alternative to other ‘risk’ assets ranging from investment grade credit through the spectrum all the way to unprofitable tech stocks.
Interest Rates
The value of every income producing asset, everywhere in the world, is priced off the rate of return that can be achieved by investing in government backed bonds. A sample of current market interest rates is shown below.
Government Bond Rates
US 2 Year Bonds = 4.48%
US 10 Year Bonds = 4.21%
AUS 2 Year Bonds = 3.60%
AUS 10 Year Bonds = 4.21%
Corporate Bond Rates
US Composite “A” rated bonds = 5.88%
US Non-Investment Grade Bonds = 9.33%
Term Deposits (Government Guarantee up to $250K per investor)
Judo Bank 1 Year = 3.90%
AMP Bank 2 Year = 4.45%
The numbers above show how significant the increase has been in Australian interest rates. We have recently had clients rolling off 1 year deposits that were 0.80% and now picking up 3.80%.
Impact on Financial Markets
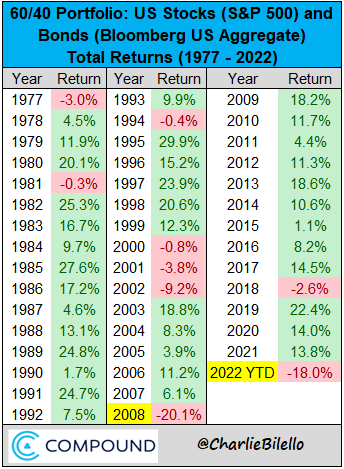
US Markets have already had one of their worst periods for 60/40 stock/bond portfolios since 2008.
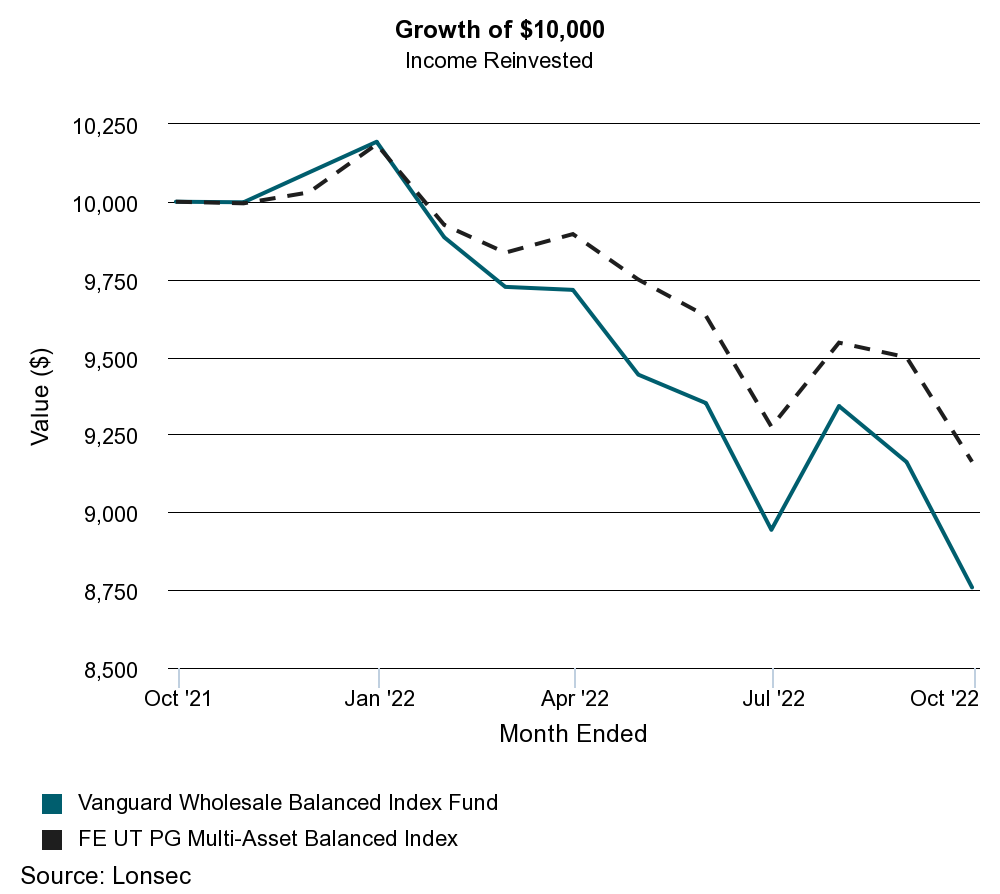
In Australia, the typical Balanced Portfolio benchmark has done better than the US. This is mostly because our share market has done better so far, (the ASX200 including dividends is only down 7.8% year to date), and the Aussie dollar has dropped vs US dollar which has helped to offset the losses on global stocks. The unhedged Vanguard MSCI International Shares ETF is only down 12.52%, versus the S&P500 down 21.26% in USD terms and the German market down 20.53%.
The chart below shows the Vanguard Balanced Index fund over the twelve months to the end of September was down 12.41%, while the Financial Express Balanced fund universe of actively managed funds is showing -8.37%.
Could things get worse?
In a word – YES. However, that doesn’t necessarily mean an automatic sell. The charts to follow help visualise this bear market versus prior market downturns. The purpose of this is simply to contextualise where we are and what could happen, so as to make appropriate preparations.
Jesse Felder (you can join up for free subscriptions here: https://thefelderreport.com/) has prepared this data set (in red) which is a composite of the last three big US bear markets, 73/74, 01/02 and 2008. Over the top (in blue) he has overlayed the path of the S&P500 since July 2021.
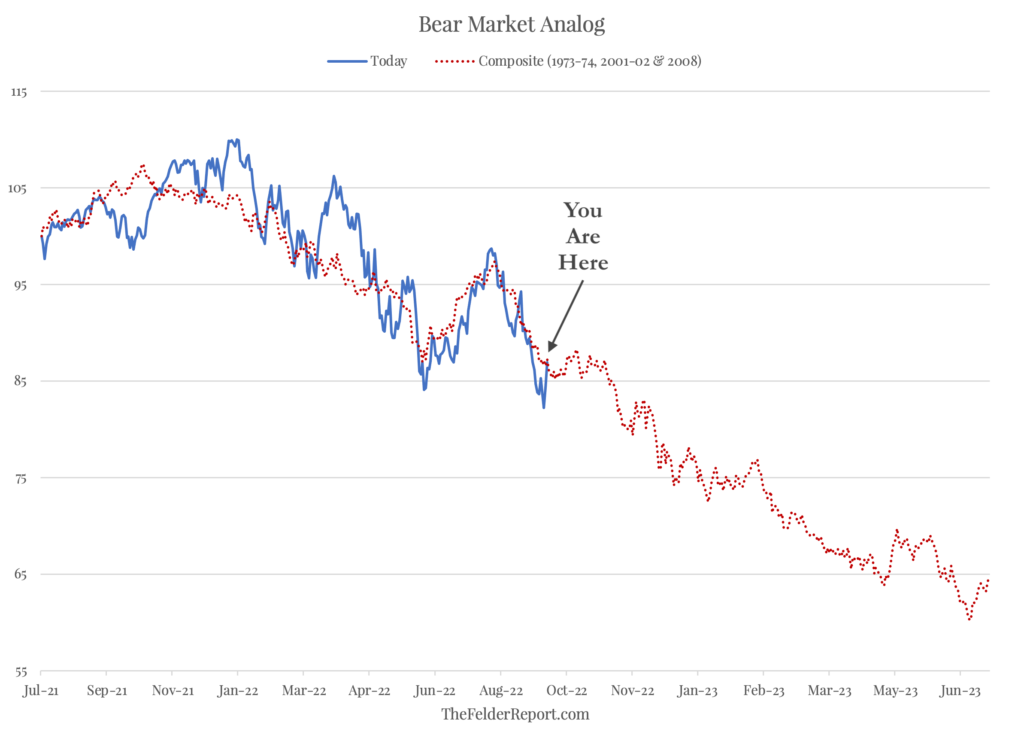
If historical averages are a guide, US markets could have another 23% fall before the bottom. But we can’t assume that will be the certainly. If there is one thing I have learned in 33 years of market watching, it is that markets will confound your best laid out thesis in ways you never thought possible.
One more chart which is a little more esoteric is the scatter plot below.
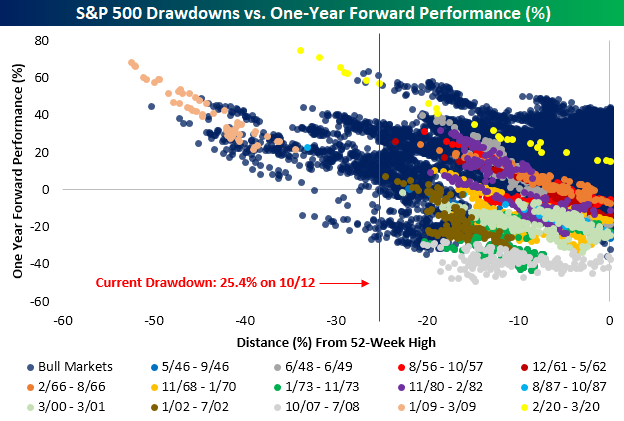
The chart shows the forward one year returns when markets have been down by the percentage on the X axis. In other words, the bottom row of numbers shows the percentage loss from the highest point in the year.
On the Y axis (the vertical) it shows the subsequent one year gain. As you can see the S&P500 is now down 25.4% from the all time high. Once it reaches -34% below a one year peak, the market has always been positive over the following twelve months.
So, the good news (based on history) is that if the S&P500 falls another 11.5%, we can be almost certain that from that point, the forward one year return will be a positive number. Note, that doesn’t mean that it can’t go any lower – it certainly could during that year – but once you are down 34% a year after that point you should end up positive.
What should you do?
Good financial advisers help their clients to stay invested when they are fearful and try to stop them from overleveraging when they are greedy. Controlling the emotions of fear and greed is a key to successful investing. Great financial advisers also explain clearly the risks, and that is what we have always been about.
The decision to sell can seem easy. But once sold and sitting in the security of cash, it can be really hard to get reinvested. The best returns in markets are often within the first weeks or months of a bottom. The trouble is that it is only with hindsight years later that we can be certain of a bottom being in place. In the meantime, there can be lots of sharp rallies that may look like a bottom, which then fizzle out with the market going lower. After 3 or 4 or these, investors tend to get very jaded, and mistrust the first and maybe second rally off the ultimate low.
Each individual should be armed with as much knowledge as possible, so as to decide whether they will be more concerned about possible losses, or about missing out on possible gains.
That way our one on one discussions can be so much more productive as we build out the right portfolio for your preferences and circumstances.

