The year 2025 made some very handy returns for investors.
With a tail wind from interest rates cuts in most countries during the year ‘risk assets’ did very well.
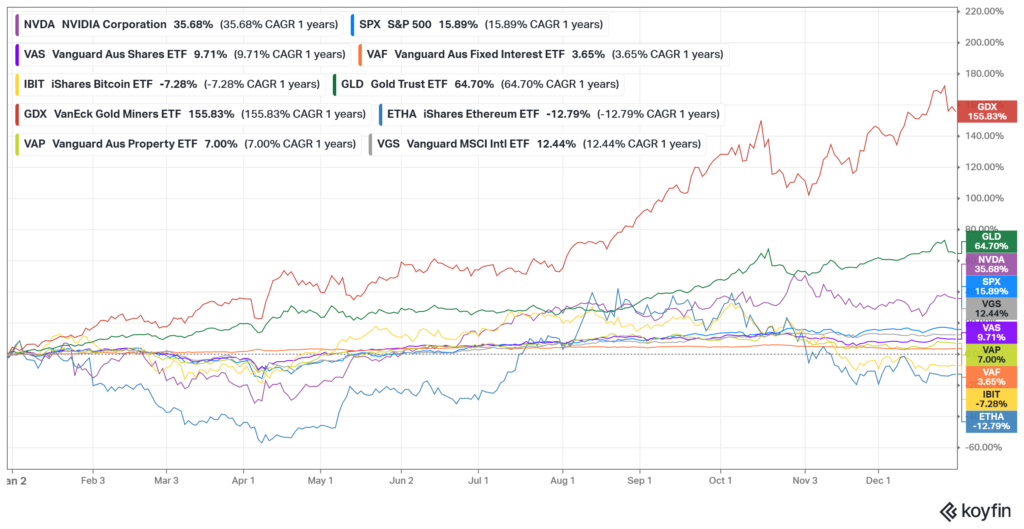
The US S&P500 Index gained 15.89% in USD terms, while the AI market darling Nvidia gained 35.68%
International shares, as represented in the market cap weighted Vanguard Global Shares ETF gained 12.44% for the year. A large part of the global index is the USA at 73.6% of all global shares.
The Australian sharemarket gained 9.71% as measured by the Vanguard market cap weighted Australian shares Exchange Traded Fund, VAS.
Listed Property continued its recovery with a 7% return for the year, though it was up 13.7% towards the end of October before the interest rate winds changed.
Speaking of interest rates, the Vanguard Australian Fixed Income ETF (which holds a lot of government bonds) was up 6.07% in late October, but that return trickled away to a 3.65% gain for the full year when interest rates started to back up in November and December.
The real stand outs were precious metals. Gold was up 64% in USD terms, and the Gold Miner stocks gained 155.8% as measured by the GDX.
On the other hand, ‘digital gold’ as bitcoin has become known, was down 7.28% over the 12 months, while Etherium was down 12.79%.
What were the pivotal points?
There were two big catalysts during the year.
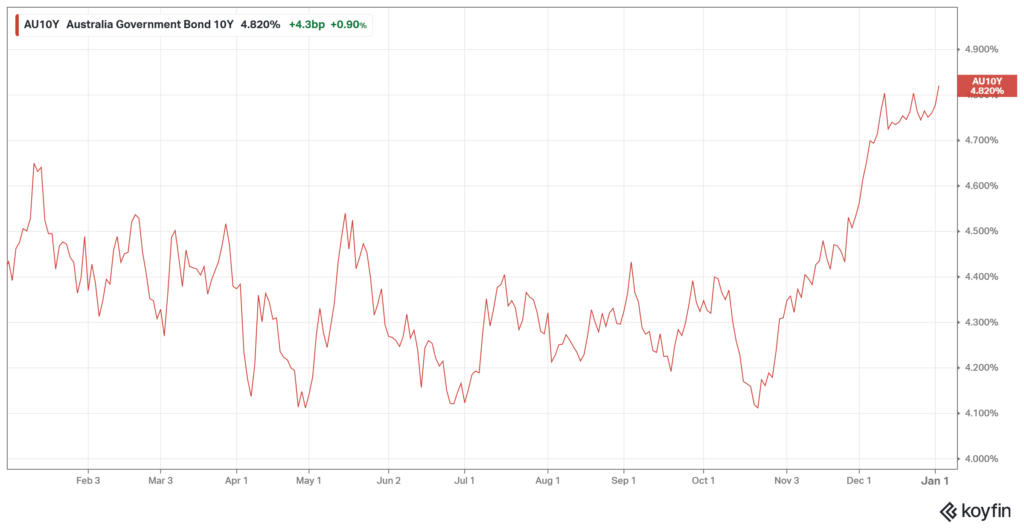
The Trump Tariffs in late February to early April, then the realisation that we may have seen the last interest rate cuts in Australia for some time around October.
The chart below shows how quickly the ten year bond yields in Australia rose with the surprise inflation number.
The next chart showing specific stock sectors brings those pivot points into a clear focus.
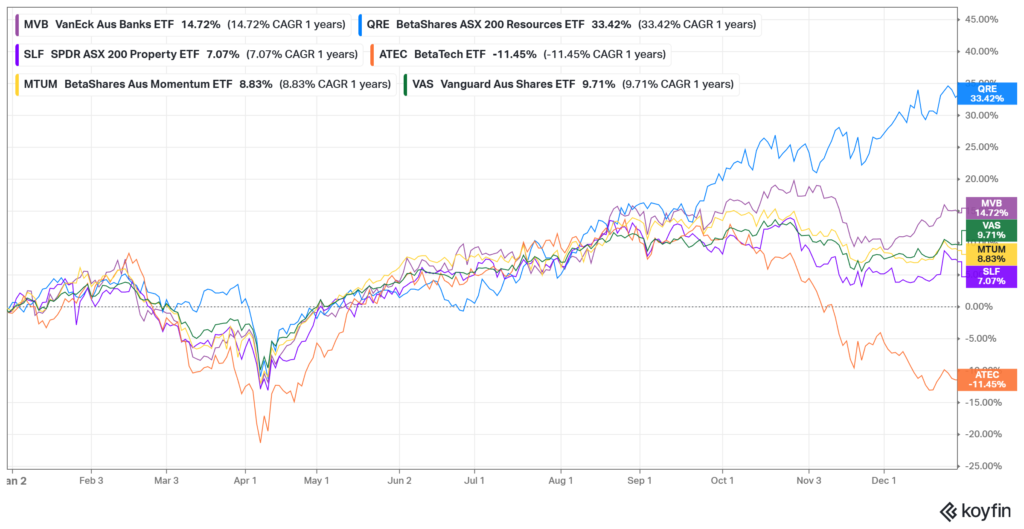
As can be seen, all sectors were selling off together into the Trump Tariff Tantrum in March. Then from early April they all rose together until September. Then there was a real divergence with Materials continuing much higher, while Australian Technology stocks took a dive, finishing down 11.45% over the year.
Where to next?
“Past performance is no indication of future returns”. That common warning is often ignored by investors who chase what was hot last year, and ditch what has underperformed, in the process ignoring wonderful opportunities. On the other hand Isaac Newton’s universal law of motion could also be invoked. He said; “An object at rest stays at rest and an object in motion stays in motion with the same speed and the same direction unless acted upon by an unbalanced force”.
Will gold (and silver) continue the spectacular run of 2025?
Will A.I. names and Technology companies continue to push higher against a backdrop of lofty valuations and expectations?
What about interest rates?
Investors should be cautious when an asset goes parabolic, as silver and gold have recently. No doubt the metals have benefited from the rising distrust in government ‘paper’. The rise in long term interest rates is the evidence that market participants are demanding a higher rate of return on long term bonds to compensate for the risk that inflation stays higher for longer and that governments keep the money printers whirring. There is also a lot more demand from sovereign nations who prefer the idea of holding a universal currency (gold) that is not controlled by the USA. However, some historical context may be helpful when contemplating an investment in silver, or gold for that matter. The chart below shows the silver price and the two previous big spikes following the inflation of the 70’s and the GFC aftermath in 2009-2011.
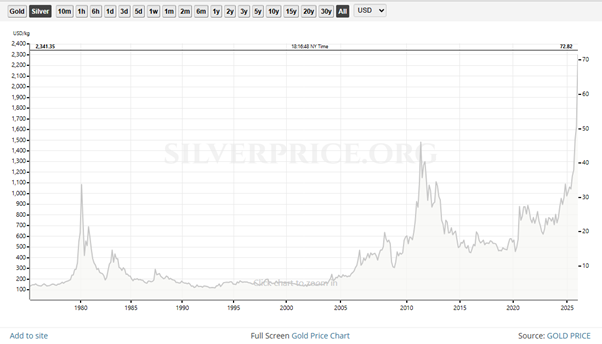
On an inflation adjusted basis silver could certainly go much higher yet. However, at this point you are speculating, not investing, and you had better have a good exit strategy if you want to avoid a lost decade or two that followed previous parabolic silver runs.
Equity valuations are high as we start 2026. But so far there has been nothing that has brought an end to the flow of funds into equities. During the two months to December 12th 2025, US Equity ETF’s have attracted a flow of $5.5 billion per day. While that continues, equities can remain strongly bid. At the same time, active managed funds have been losing ground. Bank of America reported that global active equity fund outflows will be $605 billion in 2025.
It is hard to predict when this might change. We do know that on average almost every year brings a 10% decline at some point for the share market. We also know that every 6 to 10 years there will be a decline of 20% or more. Our approach has been a gradual move from Managed funds, which are by their nature quite opaque, to a mix of direct shares via Managed Accounts combined with ETF’s to obtain exposure to assets where it is too difficult to properly diversify with direct holdings. As investors, when we can see our ownership of a specific company, we tend to have a better psychological attachment which provides an antidote to selling out at market lows in the midst of a panic. More of this in 2026.
Interest rates are the core of an economy. Too low and speculation and non-productive borrowing occurs; too high and the economy is stifled below real growth potential. Right now in the USA there is real pressure from Trump to force official interest rates lower. He has been a constant critic of Fed Reserve Chair Jerome Powell. When Powell’s term ends in May 2026 we can be sure the replacement will be a ‘dove’ (an advocate for lower interest rates). As this is being written, Jerome Powell is preparing a statement to be delivered amid the chaos of the US operations to grab Nicolas Maduro from his home in Caracas. Who knows what Powell will do next.
However, it seems the US trend is to lower interest rates. This is likely to result in a lower US dollar, with higher long term US interest rates, but also a tailwind to the US equity markets. All things being equal (and they never are) one would continue to own US equities, in spite of high valuations, with a hedge on the US currency.
Here in Australia the speculation is that maybe rates have bottomed for this cycle. The 3.20% inflation print in October ended the idea that the next interest rate move would be down. The September quarter alone posted a 1.3% increase, which annualises at 5.3%. Right now, the ASX RBA Rate Tracker index implies a 66% chance of no change in February, and a 34% chance of a rate rise.
The Australian ten year bond yield has already had a marked increase from 4.11% in October just before the CPI announcement, to hit a peak of 4.82% as we go to print with this update.
Conclusion
Investors face a world with few options that look ‘cheap’ by historical standards. Some that may look cheap are also risky. Warren Buffett who retired as Berkshire Hathaway CEO on 31 December said, “It’s far better to buy a wonderful company at a fair price than a fair company at a wonderful price.”
It is important to be honest with ourselves when investing. Do I have some edge in this market? Am I realistic about the outlook? Do I expect this to keep going up just because I have suddenly ‘discovered’ it? Is this asset part of my speculative money pool or my long-term investing pool? If I am speculating, what is the exit plan?
As we enter 2026, the world is looking at Iran and Venezuela as both countries face watershed moments. We do not know how this will play out.
Things can change quickly, but quality assets will remain.